



Boston Common Golf
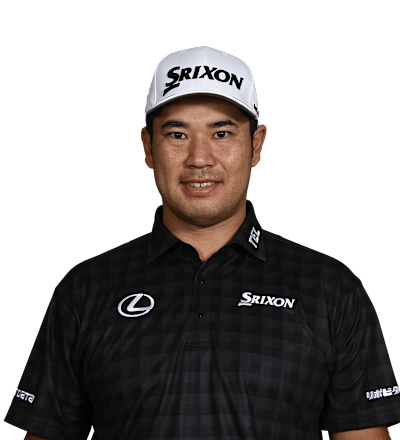
Boston Common Golf
HidekiMatsuyama
Country

Japan
Age
34Turned Pro
2013Birthplace
Ehime, JapanCollege
Tohoku Fukushi UniversityPGA Tour Wins
11Wins (2026)
0Top 10 (2026)
6



World Rank
(OWGR)
27Japan
Hideki Matsuyama

Hideki Matsuyama
Japan
Stat Rankings
| STAT | RANK |
|---|---|
SG: Total Field AVG 0.759 | 22 |
SG: Off The Tee Field AVG -0.051 | 108 |
SG: Approach to Green Field AVG 0.430 | 24 |
SG: Putting Field AVG -0.013 | 95 |
Total Driving Field AVG 185 | 111 |
Driving Distance Field AVG 304.1 | 108 |
Driving Accuracy Field AVG 62.09% | 77 |
GIR % Field AVG 66.03% | 122 |
Proximity Field AVG 35' 6 | 30 |
Approach > 200 yds Field AVG 45' 6 | 11 |
Scrambling Field AVG 64.05% | 19 |
Sand Save % Field AVG 58.54% | 23 |
Scrambling from rough Field AVG 52.47% | 131 |
Putting Avg Field AVG 1.742 | 60 |
Putts Per Round Field AVG 28.41 | 25 |
One-putt % Field AVG 42.01% | 32 |
Scoring Average Field AVG 69.39 | 37 |
Par 4 Field AVG 3.98 | 33 |
Birdie Average Field AVG 4.11 | 37 |
SG: Total
22nd
0.759
Field AVGSG: Off The Tee
108th
-0.051
Field AVGSG: Approach to Green
24th
0.430
Field AVGSG: Putting
95th
-0.013
Field AVGTotal Driving
111th
185
Field AVGDriving Distance
108th
304.1
Field AVGDriving Accuracy
77th
62.09%
Field AVGGIR %
122nd
66.03%
Field AVGProximity
30th
35' 6
Field AVGApproach > 200 yds
11th
45' 6
Field AVGScrambling
19th
64.05%
Field AVGSand Save %
23rd
58.54%
Field AVGScrambling from rough
131st
52.47%
Field AVGPutting Avg
60th
1.742
Field AVGPutts Per Round
25th
28.41
Field AVGOne-putt %
32nd
42.01%
Field AVGScoring Average
37th
69.39
Field AVGPar 4
33rd
3.98
Field AVGBirdie Average
37th
4.11
Field AVG| STAT | VALUE | RANK | SUPPORTING STAT | VALUE |
|---|---|---|---|---|
| SG: Total | 0.759 | 22 | Total SG:T(62.989) | Measured Rounds(83) |
| SG: Tee-to-Green | 0.772 | 21 | SG:OTT(-0.051) | Measured Rounds(83) |
| SG: Off-the-Tee | -0.051 | 108 | Total SG:OTT(-4.235) | Measured Rounds(83) |
| SG: Approach the Green | 0.430 | 24 | Total SG:APP(35.702) | Measured Rounds(83) |
| SG: Around-the-Green | 0.392 | 8 | Total SG:ARG(32.576) | Measured Rounds(83) |
| SG: Putting | -0.013 | 95 | Total SG:Putting(-1.072) | Measured Rounds(83) |
| Longest Drives | 376 | 172 | Tournament(U.S. Open) | Round(1) |
| Driving Distance | 304.1 | 108 | Total Distance(55,958) | Total Drives(184) |
| Driving Distance - All Drives | 292.6 | 108 | Total Distance(339,987) | # of Drives(1,162) |
| Driving Accuracy Percentage | 62.09% | 77 | Fairways Hit(837) | Possible Fairways(1,348) |
| Left Rough Tendency | 12.31% | 80 | Total Left rough(142) | Possible Fwys(1,154) |
| Right Rough Tendency | 14.47% | 116 | Total Right rough(167) | Possible Fwys(1,154) |
| Distance from Edge of Fairway | 28' 2 | 107 | Total Distance (Feet)(12,024.750) | Total Strokes(427) |
| Club Head Speed | 115.11 | 118 | Total Club Head Speed(47,542.32) | Total Attempts(413) |
| Total Driving Efficiency | 175 | 93 | Carry Efficiency Rank(103) | |
| Greens in Regulation Percentage | 66.03% | 122 | Greens Hit(1,141) | # Holes(1,728) |
| Proximity to Hole | 35' 6 | 30 | Total Distance (feet)(52,417.667) | # of Attempts(1,477) |
| Approaches from > 275 yards | 73' 9 | 42 | Total Distance (feet)(2,360.500) | # of Attempts(32) |
| Approaches from 250-275 yards | 52' 1 | 12 | Total Distance (feet)(1,719.000) | # of Attempts(33) |
| Approaches from 225-250 yards | 51' 7 | 119 | Total Distance (feet)(3,041.333) | # of Attempts(59) |
| Approaches from 200-225 yards | 35' 3 | 5 | Total Distance (feet)(5,072.417) | # of Attempts(144) |
| Approaches from > 200 yards | 45' 6 | 11 | Total Distance (feet)(12,193.250) | # of Attempts(268) |
| Approaches from 175-200 yards | 31' 8 | 27 | Total Distance (feet)(6,073.250) | # of Attempts(192) |
| Approaches from 150-175 yards | 25' 5 | 7 | Total Distance (feet)(5,957.167) | # of Attempts(234) |
| Approaches from 125-150 yards | 21' 9 | 39 | Total Distance (feet)(3,501.000) | # of Attempts(161) |
| Approaches from 50-125 yards | 17' 9 | 31 | Total Distance (feet)(4,090.833) | # of Attempts(231) |
| Approaches from 100-125 yards | 19' 3 | 63 | Total Distance (feet)(2,909.417) | # of Attempts(151) |
| Approaches from 75-100 yards | 14' 10 | 19 | Total Distance (feet)(919.167) | # of Attempts(62) |
| Approaches from 50-75 yards | 14' 7 | 54 | Total Distance (feet)(262.250) | # of Attempts(18) |
| Approaches from inside 100 yards | 15' 1 | 24 | Total Distance (feet)(1,266.000) | # of Attempts(84) |
| Approaches from > 100 yards | 30' 5 | 2 | Total Distance (feet)(30,634.083) | # of Attempts(1,006) |
| Fairway Proximity | 29' 3 | 2 | Attempts(1,090) | |
| Rough Proximity | 50' 11 | 160 | Total Distance (inches)(161,995) | Attempts(265) |
| Left Rough Proximity | 50' 6 | 152 | Attempts(137) | |
| Right Rough Proximity | 51' 5 | 149 | Attempts(128) | |
| Approaches from > 275 yards (Rgh) | 104' 11 | 104 | Total Distance (feet)(314.833) | # of Attempts(3) |
| Approaches from 250-275 yards (Rgh) | 82' 8 | 91 | Total Distance (feet)(496.083) | # of Attempts(6) |
| Approaches from 225-250 yards (Rgh) | 78' 10 | 123 | Total Distance (feet)(1,024.500) | # of Attempts(13) |
| Approaches from 200-225 yards (Rgh) | 74' 8 | 140 | Total Distance (feet)(1,867.333) | # of Attempts(25) |
| Approaches from > 100 yards (Rgh) | 54' 0 | 159 | Total Distance (feet)(12,900.750) | # of Attempts(239) |
| Approaches from inside 100 yards (Rgh) | 23' 0 | 34 | Total Distance (feet)(598.833) | # of Attempts(26) |
| Approaches from > 200 yards (Rgh) | 78' 9 | 127 | Total Distance (feet)(3,702.750) | # of Attempts(47) |
| Approaches from 175-200 yards (Rgh) | 57' 8 | 131 | Total Distance (feet)(2,190.000) | # of Attempts(38) |
| Approaches from 150-175 yards (Rgh) | 52' 3 | 154 | Total Distance (feet)(3,607.750) | # of Attempts(69) |
| Approaches from 125-150 yards (Rgh) | 42' 11 | 137 | Total Distance (feet)(2,145.333) | # of Attempts(50) |
| Approaches from 50-125 yards (Rgh) | 30' 3 | 90 | Total Distance (feet)(1,662.333) | # of Attempts(55) |
| Approaches from 100-125 yards (Rgh) | 35' 10 | 137 | Total Distance (feet)(1,254.917) | # of Attempts(35) |
| Approaches from 75-100 yards (Rgh) | 19' 1 | 8 | Total Distance (feet)(247.750) | # of Attempts(13) |
| Approaches from 50-75 yards (Rgh) | 22' 10 | 69 | Total Distance (feet)(159.667) | # of Attempts(7) |
| Going for the Green | 57.60% | 133 | Attempts(163) | Non-Attempts(120) |
| Going for the Green - Hit Green Pct. | 28.22% | 43 | Successes(46) | Attempts(163) |
| Going for the Green - Birdie or Better | 62.58% | 66 | # of Birdie or Better(102) | Attempts(163) |
| Total Hole Outs | 24 | 9 | ||
| Longest Hole Outs (in yards) | 62 | 97 | Tournament(Rocket Classic) | Round- Course(4) |
| Scrambling | 64.05% | 19 | Par or Better(376) | Missed GIR(587) |
| Scrambling from the Rough | 52.47% | 131 | Successes(85) | Attempts(162) |
| Scrambling from the Fringe | - | - | ||
| Scrambling from > 30 yards | 38.20% | 18 | Successes(34) | Attempts(89) |
| Scrambling from 20-30 yards | 58.33% | 41 | Successes(56) | Attempts(96) |
| Scrambling from 10-20 yards | 74.55% | 5 | Successes(167) | Attempts(224) |
| Scrambling from < 10 yards | 86.52% | 112 | Successes(77) | Attempts(89) |
| Sand Save Percentage | 58.54% | 23 | # Saves(96) | # Bunkers(164) |
| Proximity to Hole from Sand | 9' 5 | 75 | Total Distance (feet)(1,274.250) | # of Shots(135) |
| Total Putting | 247.3 | 140 | ||
| Putting Average | 1.742 | 60 | GIR Putts(1,988) | Greens Hit(1,141) |
| Overall Putting Average | 1.578 | 25 | # of Putts(2,727) | # of Holes(1,728) |
| Birdie or Better Conversion Percentage | 33.48% | 42 | # Birdies(381) | Greens Hit(1,138) |
| Putts Per Round | 28.41 | 25 | Total Putts(2,727) | Total Rounds(96) |
| Putts per Round - Round 1 | 28.38 | 40 | Total Putts(681) | Total Rounds(24) |
| Putts per Round - Round 2 | 28.71 | 63 | Total Putts(689) | Total Rounds(24) |
| Putts per Round - Round 3 | 28.71 | 81 | Total Putts(689) | Total Rounds(24) |
| Putts per Round - Round 4 | 27.83 | 11 | Total Putts(668) | Total Rounds(24) |
| One-Putt Percentage | 42.01% | 32 | # of 1 putts(726) | # of holes(1,728) |
| Longest Putts | 63' 0 | 44 | Year/Tourn#(Rocket Classic) | Round(3) |
| 3-Putt Avoidance | 2.72% | 98 | Total 3 Putts(47) | Total Holes (overall)(1,728) |
| Putting from - > 25' | 7.19% | 18 | Attempts(334) | Putts made(24) |
| Putting from - 20-25' | 15.70% | 41 | Attempts(121) | Putts made(19) |
| Putting from - 15-20' | 18.54% | 124 | Attempts(151) | Putts made(28) |
| Putting from - 10-15' | 29.55% | 132 | Attempts(220) | Putts made(65) |
| Putting - Inside 10' | 87.28% | 135 | Attempts(1,533) | Putts made(1,338) |
| Putting from 10' | 42.86% | 94 | Attempts(49) | |
| Putting from 9' | 47.27% | 93 | Attempts(55) | |
| Putting from 8' | 58.44% | 49 | Attempts(77) | |
| Putting from 7' | 57.83% | 112 | Attempts(83) | |
| Putting from 6' | 69.77% | 90 | Attempts(86) | |
| Putting from 5' | 81.34% | 98 | Attempts(134) | |
| Putting from 4-8' | 68.95% | 89 | Attempts(380) | Putts made(262) |
| Putting from 4' | 90.70% | 130 | Attempts(172) | |
| Putting from 3' | 99.54% | 87 | Attempts(877) | |
| Average Distance of Putts made | 73' 1 | 65 | Total Dist. (inches)(76,288) | Total Rounds(87) |
| Approach Putt Performance | 2' 3 | 119 | Attempts(843) | |
| Scoring Average (Adjusted) | 69.987 | 22 | Total Strokes(6,661) | Total Adjustment(57.798) |
| Scoring Average (Actual) | 69.39 | 37 | Total Strokes(6,661) | Total Rounds(96) |
| Lowest Round | 64 | 121 | Tourn/Course(Rocket Classic/) | Round(4) |
| Birdie Average | 4.11 | 37 | # of Birdies(395) | Total Rounds(96) |
| Total Birdies | 395 | 8 | ||
| Eagles (Holes per) | 192.0 | 115 | # of Holes(1,728) | # of Eagles(9) |
| Total Eagles | 9 | 64 | ||
| Par Breakers | 23.38% | 39 | # Birdies/Eagles(404) | # Holes(1,728) |
| Bounce Back | 28.02% | 10 | ||
| Par 3 Birdie or Better Leaders | 15.26% | 37 | Par 3 Birdies or Better(58) | Par 3 Holes(380) |
| Par 4 Birdie or Better Leaders | 19.70% | 32 | Par 4 Birdies or Better(212) | Par 4 Holes(1,076) |
| Par 5 Birdie or Better Leaders | 49.26% | 85 | Par 5 Birdies or Better(134) | Par 5 Holes(272) |
| Birdie or Better Percentage | 23.38% | 39 | Total Birdies(404) | Total Holes(1,728) |
| Bogey Avoidance | 14.64% | 73 | Bogeys(253) | Holes Played(1,728) |
| Final Round Scoring Average | 69.13 | 38 | Total Strokes(1,659) | Total Rounds(24) |
| Final Round Performance | 62.50% | 44 | ||
| Round 1 Scoring Average | 68.96 | 19 | Total Strokes(1,655) | Total Rounds(24) |
| Round 2 Scoring Average | 69.63 | 64 | Total Strokes(1,671) | Total Rounds(24) |
| Round 3 Scoring Average | 69.83 | 93 | Total Strokes(1,676) | Total Rounds(24) |
| Round 4 Scoring Average | 69.13 | 39 | Total Strokes(1,659) | Total Rounds(24) |
| Par 3 Scoring Average | 3.02 | 48 | Total Strokes(1,148) | Total Holes(380) |
| Par 4 Scoring Average | 3.98 | 33 | Total Strokes(4,283) | Total Holes(1,076) |
| Par 5 Scoring Average | 4.52 | 39 | Total Strokes(1,230) | Total Holes(272) |
| Front 9 Scoring Average | 34.35 | 16 | Total Strokes(3,298) | Total Holes(96) |
| Back 9 Scoring Average | 35.03 | 85 | Total Strokes(3,363) | Total Holes(96) |
| Early Scoring Average | 69.83 | 104 | Total Strokes(3,282) | Total Early Rounds(47) |
| Late Scoring Average | 68.96 | 12 | Total Strokes(3,379) | Total Late Rounds(49) |
| Consecutive Cuts | 35 | 1 | ||
| Current Streak without a 3-Putt | 49 | 96 | ||
| Consecutive Fairways Hit | 16 | 142 | Current Streak(0) | |
| Consecutive GIR | 20 | 47 | Current Streak(4) | Round(1) |
| Consecutive Sand Saves | 9 | 14 | Current Streak(0) | Round(3) |
| Best YTD 1-Putt or Better Streak | 7 | 100 | ||
| Best YTD Streak w/o a 3-Putt | 163 | 83 | Current Streak(49) | |
| YTD Par or Better Streak | 18 | 22 | ||
| Consecutive Par 3 Birdies | 2 | 115 | ||
| Consecutive Holes Below Par | 6 | 9 | ||
| Consecutive Birdies Streak | 6 | 7 | ||
| Consecutive Birdies/Eagles streak | 5 | 5 | ||
| Official Money | $6,180,807 | 22 | YTD Victories |